This past Spring semester at Tufts University, we took a class about digital logic systems. We went through how to design various different things, including a fast fourier transform (FFT) processor using a butterfly architecture. As part of one of the labs, we implemented a FFT using the Nexys A7 and Xilinx Vivado, reading values from memory, putting them through the FFT, and displaying them on a 7 segment display.
The final project for the class was to take this initial design and modify it, whether that be pipelining (meaning adding registers between the stages of the FFT so that multiple signals could be processed at once), displaying the result in an interesting way, or improving on it in some other fashion. As follows is what we did.
Design
The basic idea for the design was to read data from the microphone, process it through the FFT, and display it on a VGA monitor. The signal path from the microphone to the screen operates like this (excluding VGA).

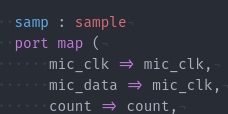
Sampler & Microphone
The Nexys A7 comes with a microphone on-board that operates using pulse-density modulation (PDM). Very similarly to pulse-width modulation, it encodes the frequencies as a rapidly changing binary signal, and depending on how fast and how long the signal changes for, changes the encoded voltage. For example, an output of all 0’s would correspond to a -1 and an output of all 1’s would correspond to a 1, or if the signal goes back and forth from -1 to 1 evenly, this would correspond to 0.

However, the FFT processor we were to use only speaks IEEE 754 floating point, and so the information from the microphone had to be converted. This is where binning comes in. By counting the number of 1’s in every 1024 consecutive samples from the microphone, this count can be used to select from a discrete number of pre-calculated floating point numbers between -1 and 1. This was then done for 8192 samples total to get 8 floating point values.
FFT
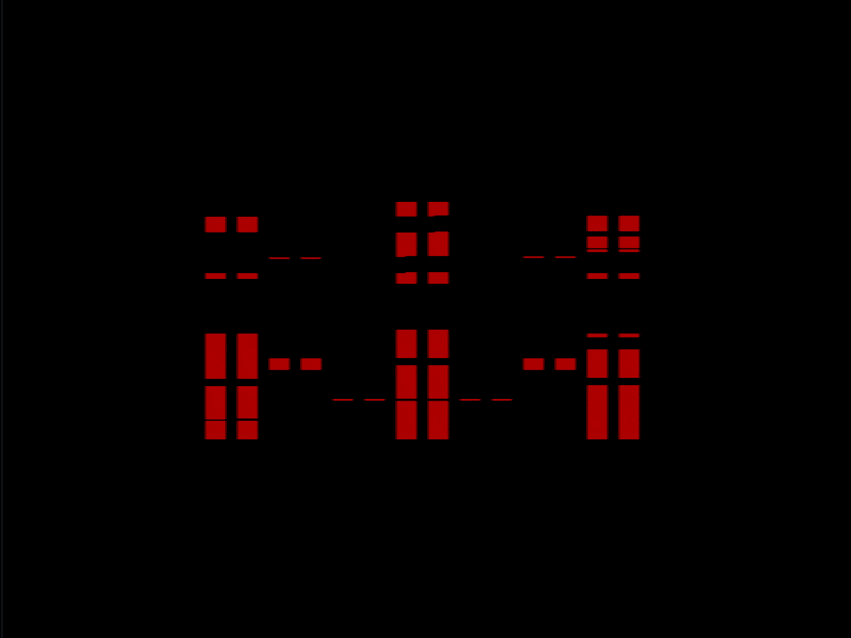
The FFT operates on a 3 stage architecture. Each of the 8 input points of the FFT is a complex number, and since we’re pulling information from the microphone, the imaginary components are zero. Each crossing of two wires within the architecture is called a butterfly, and each butterfly is a mathematical operation on the complex numbers that go into it. The overall structure looks something like this.

The specifics of how this works are beyond the limits of this blog post, but more information is available here. The importance of the FFT processor though is that it transforms the input signal from the time domain (where information about a signal are encoded as the magnitude of a signal over time) into the frequency domain (where information is encoded as the magnitude of composite sine waves that make up a signal).
Square Magnitude
As the FFT produces complex outputs, we either have the choice of displaying both real and imaginary, or combining them into one value representing the signal magnitude at that point. We opted for the latter for clarity. The square magnitude module simply multiplies each of the 16 outputs of the FFT by themselves (squaring them), and then adds together the real and imaginary components of each of the points. We chose not to implement the square root as it’s hardware intensive.
Canvas
For more information about how VGA works, see Margret’s blog post on how he got VGA working on the Upduino. We utilized a similar implementation in this project.
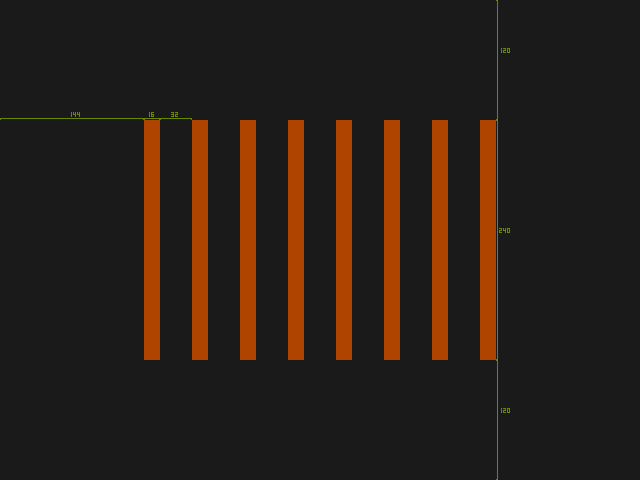
This was a pixel-perfect mockup for what we wanted the output to look like on the display:
As floating point numbers can be evaluated for inequality in both decimal and IEEE 754 form (i.e., 1.0 in IEEE 754 is 3f800000, 2.0 is 40000000, 1.0 < 2.0 at the same time that 3f800000 < 40000000), getting the height of the bars was as simple as comparing the raw hex values of the input against constant hex values representing floating points from 0.0 to 4.0, no conversions necessary.
Max Shift Register
The output of the FFT processor is very noisy. To smooth this out, we implemented what we call a max shift register. Its basic function is to take in a new value at the rising edge of a clock, shifting signals over and getting rid of the first signal, like a normal shift register. What makes this different is that it has an additional output that returns the maximum of all of the values within it.
By creating another canvas that only showed the top 6 pixels of each vertical bar (instead of the whole thing), and tying the input of the canvas to the output of the max shift register, a smoother output can be seen.
Pipelining
As the limit of how fast data can be reasonably processed is the display, and the display only updates every 16.67 ms, we decided not to implement pipelining in the FFT processor. Doing so would only increase hardware complexity for no real-world reduction in time complexity.
If we did implement pipelining, however, it would look the same as the FFT architecture above, except for registers between each stage. This allows for multiple signals to be processed at once, increasing efficiency.
Implementation
Implementation of the design took about a week after the design was finalized. It was developed iteratively, starting with the easy and familiar parts, then adding parts on top, making sure they worked before moving on.
As the FFT was created earlier in the semester, no work had to be done for this.
VGA and Canvas
This was the most familiar to us starting this project. A VGA entity was created for generating the HSYNC and VSYNC signals, as well as row and column signals for signifying which pixel on the screen to do color for. We used the row / column signals to create a canvas entity for the bars at the positions from the diagram above, taking in 8 values corresponding to the 8 points, binning them into pixel values, and highlighting the requisite parts of the screen. We then tested this by giving the canvas values from 0 to 1 in 1/8 increments, and it worked successfully.
For testing the VGA, for portability, we used a VGA to HDMI adapter and an HDMI capture card, which then the output of the FPGA could be viewed on a computer.
There was a bug we ran into where, since the FFT data was changing so fast, the data on the screen would change as the screen was being written. Latching the output of the FFT to row 480 of the display fixed this issue.
Sampler
This bug took two days to find and had us scratching our heads, wondering why Vivado was broken. We’d constantly get ‘multi-driven net’ errors, and due to how slow Vivado is, every attempt at a fix would take 5-10 minutes to test. In the process we had also rewritten the sampler a few different times trying to fix it, but alas, the bug was in the component declaration for the sampler.
There was another significant issue with the sampler later on, where it was producing a significant amount of noise, seemingly randomly. As we could verify the output of the microphone using the demo software, we knew it was an issue with the sampler. After trying to fix it for a while, a friend of ours took a look at it and let me know that others within case statements really shouldn’t have anything in them. Originally we had used them like an else statement for determining which bin to put samples in. Essentially, this made it so that one of the bins always had a value of zero, which in PDM format, corresponds to -1, and thus noise.
Along the same lines, data was being taken from the sampler and put through the FFT while data was also being put into the bins (the bins didn’t go through 1024 samples yet). This also led to noise as the bin could be in any stage when being pulled, also creating noise. This was fixed by creating one working bin which is filled up, then transfered to one of the 7 bins when it is complete.
All the other components were implemented without issue and were fairly straightforward.
Results
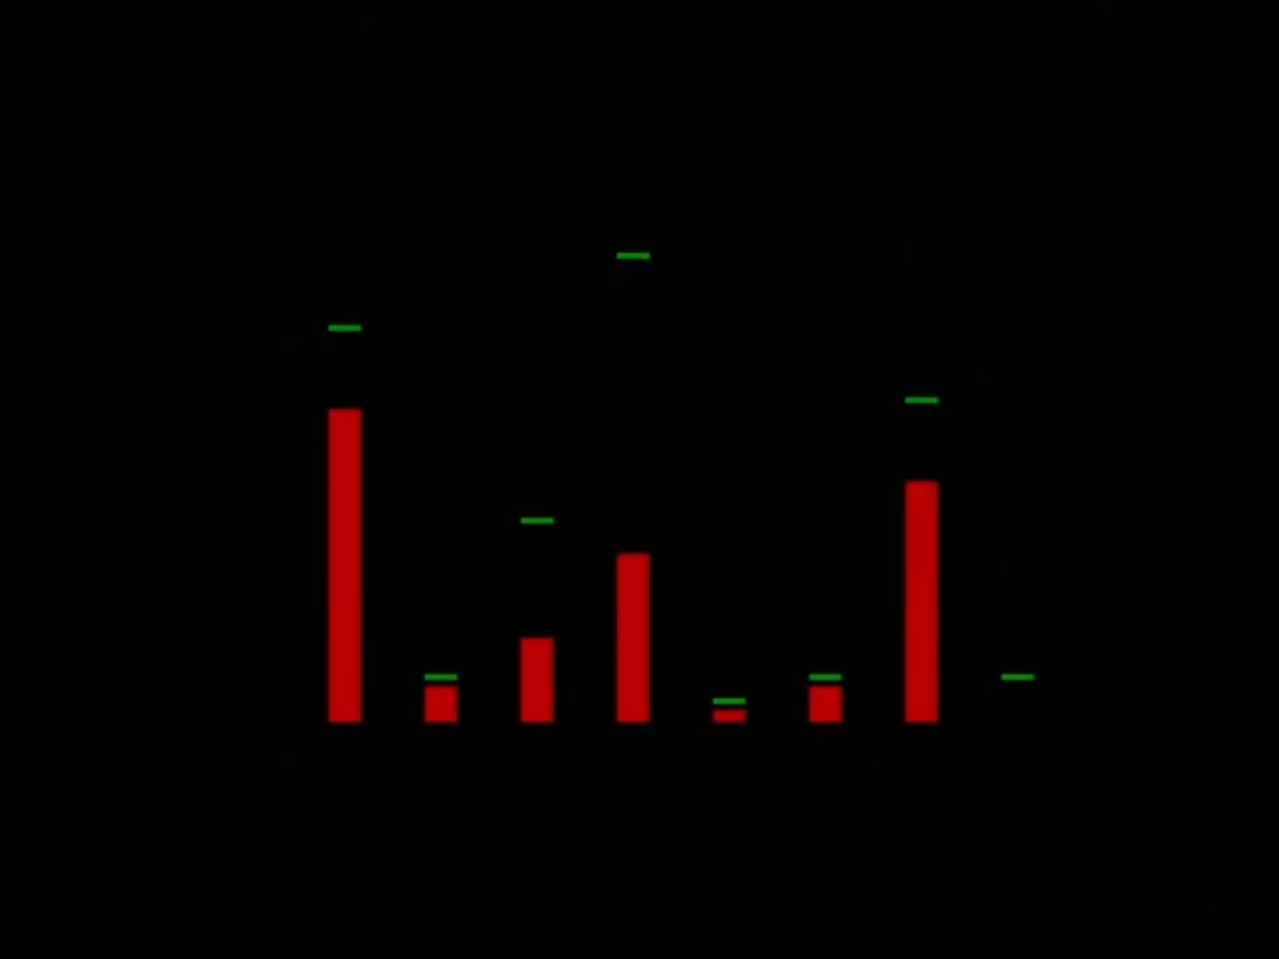
The implemented design worked successfully, displaying frequency information from the microphone on the VGA display. Unfortunately, we are unsure where exactly each of the bars falls under frequency-wise, but which bar is highest does change for different frequencies. Unfortunately as well, the microphone is not that sensitive; we had to hold a very loud sound right next to it in order to get the output below.
Here’s what the output looks like for a 650 Hz sine wave:
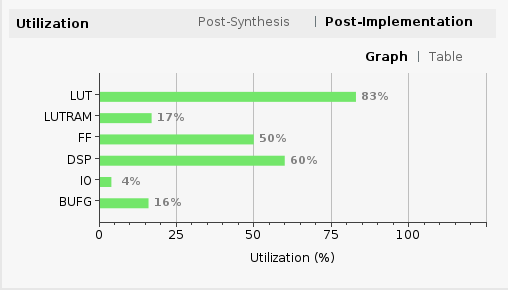
By the end we had used a significant amount of space on the device, and basically adding anything more (like increasing the number of samples for the max shift register) would make it run out of space.
Overall this was a lot of fun and gave us a lot of practice with VHDL.
Improvements
One improvement that could be made include switching from 32 bit IEEE 754 floating point to 16 or 8 bit floating point, or even fixed point. The actual resolution for calculations and displaying values doesn’t need to be that precise, and the reduction in resolution would mean more portability and space for other stuff on the device. The inputs and outputs only need to be from -4.0 to 4.0 in 1/32 increments. Doing so could also mean being able to step up to a 16 or 32 pt FFT, which would also be more useful.
Along the same lines, adding more bins between -0.25 and 0.25 could’ve made the microphone more sensitive.
Another improvement that could be made is having the sampler and FFT operate independently of the canvas, meaning the data would be constantly being sent to the FFT, and the canvas pulls from the FFT at certain parts of the screen. Currently, it operates by giving the FFT data at a certain position of the screen. This may make the output cleaner and easier to understand.